Data Feminism
Written on February 20th, 2021 by Sara Daugbjerg
Mural by Marcia Diaz (2020) inspired by Data Feminism
Data Feminism
A memo based on the principles and ideas of Data Feminism
As an aspiring data scientist wanting to explore the world of data to understand the world around me, I felt the need to educated myself on issues of injustice and bias in the first place.
The recently published book Data Feminism (2020) by Catherine D’ignazio, Assistant Professor of Urban Science and Planning in the Department of Urban Studies and Planning at MIT, and Lauren F. Klein, Associate Professor of English and Quantitative Theory and Methods at Emory University, that analyses these questions from a feministic perspective seemed to be a good reading on this matter and a good starting point for me to learn about data and the relying issues of unbalanced power structures.
In the book they don’t only go through the practices in data science that reinforce inequality and opression but also present solutions on how to approach it from a feminist stand point, seeking to create more just, equitable and livable futures. It’s important to mention that the understanding of feminism here is intersectional, meaning it’s not only about gender but also about race, class and ability.
I wanted my readings to end up as a memo of what to have in mind and what to be aware of and something that I can have by my side and return too when working on projects informed by data. I might change, challenge, and add to this memo along the years as I get more experience and knowledge on these issues. So… see this as an ongoing project.
This is a review in two parts. The first goes through the first 4 chapters. The second will go through the last 3 chapters.
In the first half of the book the authors seek to give an understanding of how to examine power structures in the field of data science and how it reveals in the various algorithms, visualizations and understandings informed by data. They also suggest strategies to overcome these issues and challenge them. Furthermore they argue for a more emotioned and embodied approach to data science and data visualization in contrast to the idea of neutrality and minimalisme. Lastly they discuss the challenges inherent to classification and how to deal with them.
Examine power
Questions to ask when examining power:
- Who is doing the work on data science? And who is not?
- Who benefits and who is overlooked?
- Whose goals are prioritized? And who’s not?
- Is the data representative? If not what is missing and why?
- Where is the data coming from and how did it become data?

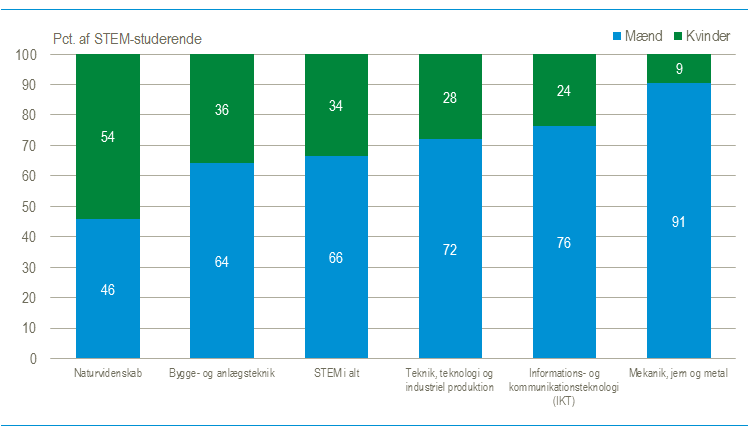
Source: Danmarks Statistik
There is still a big gap between men and women being educated in STEM. As the figure shows, In Denmark, in 2019, only 24% of the admitted students in ICT studies (Information and Communications Technologies) were women.
Challenge power
To challenge the questions on power stated above, the authors purpose the following:
- Collect: Generate counter data
- Analyze: Demonstrate inequitable outcomes across groups and develop new methods (fx. auditing algorithms)
- Imagine: Think in terms of equity, not equality.
- Teach: Ask yourself who are the data scientists of today and how to change it if unbalanced. Teach across gender, demographics, etc
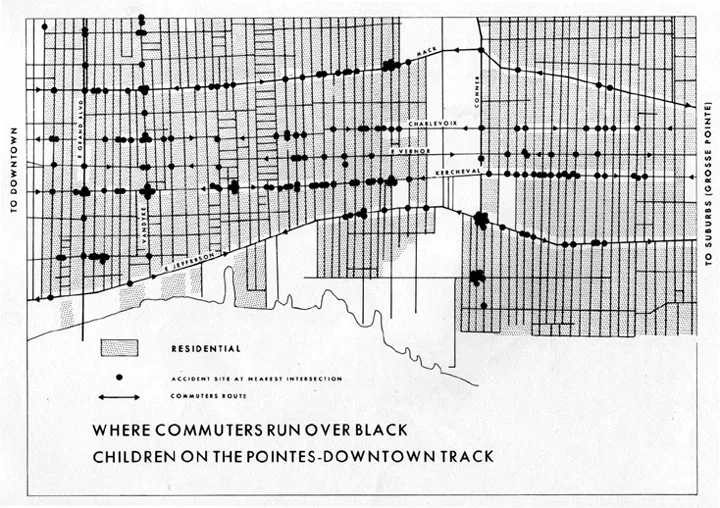
 Source: Making Maps: DIY Cartography
This map was mapped with the participation of the young black population of Detroit. It was a way to show a problem that hadn’t been investigated by the authorities and way to advocate for change.
Elevate Emotion and Embodiment
- Data is never neutral, either are the visualizations of it.
Don’t do “the good trick of seeing everything from nowhere” (Donna Harraway). All knowledge is situated, it has a cultural, historical and geographical context.
- Activate emotion and embodiment.
Work towards a more holistic ideal where emotion and embodiment are represented. Activating emotion can help people grasp and learn more from data-driven arguments.
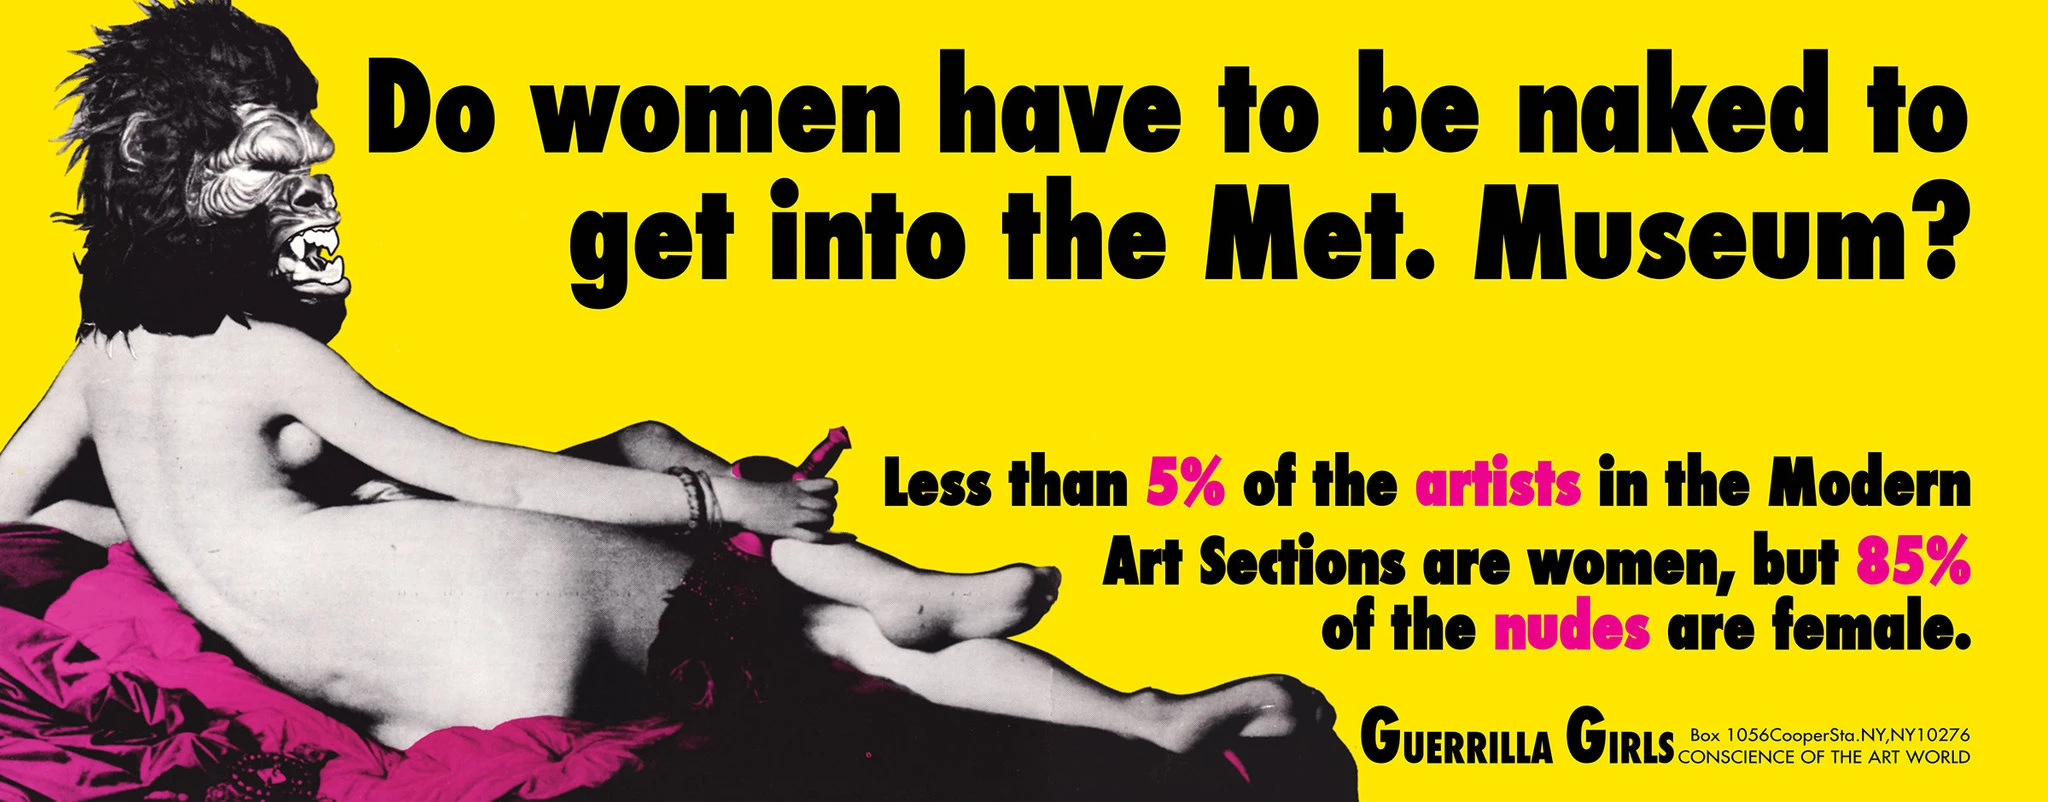
 Source: New York Times
In this poster from 1989 Guerrilla Girls, a group of anonymous American female artists, are trying to make a point about who is exhibiting in the Met. Museum. The poster was rejected by the Public Art Fund in New York and the bus company they rented advertising space on, with not very clear reasons.
Rethink Binaries
- Question classification systems.
Classification systems are needed and important when working with data and information. One needs to distinguish between personal and collective oppression. But ask your classification: What social, cultural or political values they reflect?What hidden hierarchies they reflect and whether they should exist?
- Make sure classifications don’t have bad consequences.
Have the Paradox of Exposure in mind. Classification can reinforce discrimination.
- Hack the data you are working with.
For example, use color coding to make your argument visible or show the absence of data.
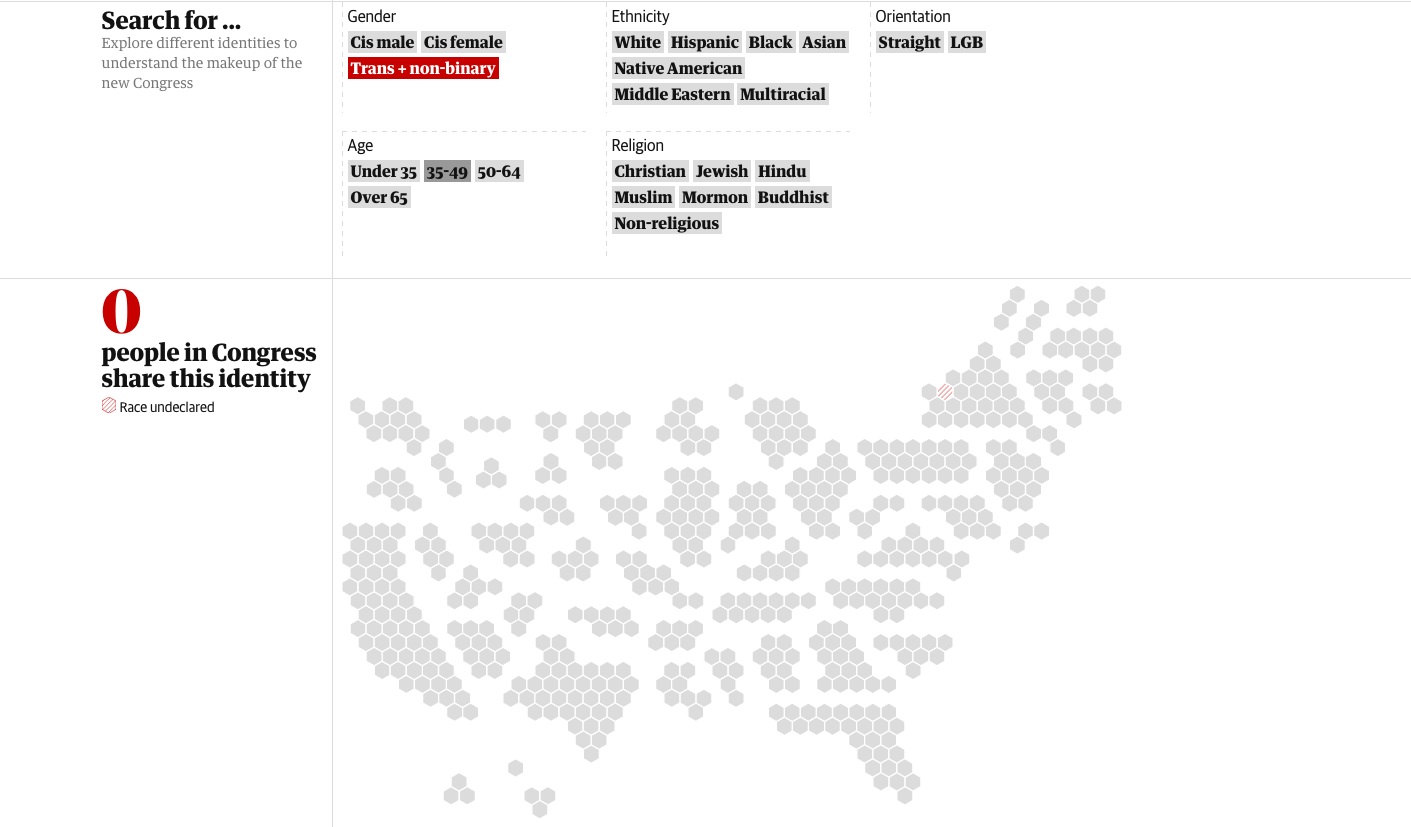
 Source: The Guardian
For the US election 2018, The Guardian made this interactive visualization where one could search for people in Congress that identified with certain parameters. Having the “Trans- non-binary” category, that by the way it’s not represented in the congress, they show that this group is not represented in the Congress.
The chapters/principles missing are
- Embrace Pluralism
- Consider Context
- Make Labor Visible